

In a collaborative effort between Jordon Mizzi and Daniel Lai (of #IngressStatistics) we bring you results from the second #IngressFS event on December 06, 2014.
According to official numbers from Ingress posted previously, there were over 140 events, a total of increase 558 levels, and an increase of 355,739,195AP.
As usual, Niantic withheld the details, but through an impressive crowdsourcing effort, Jordon was able to gain Level and AP information from 53 cities, attended by 2316 agents.
Geography and Faction Distribution
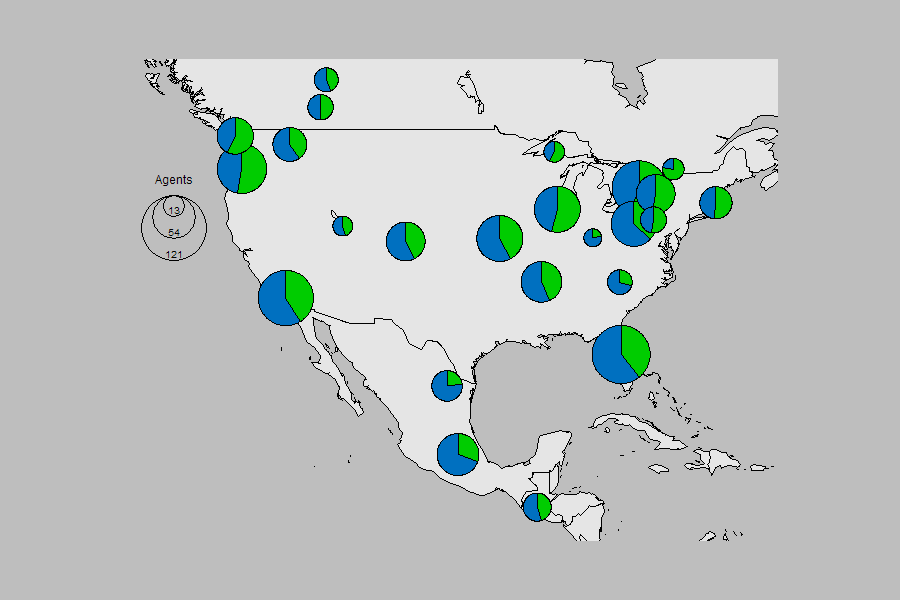
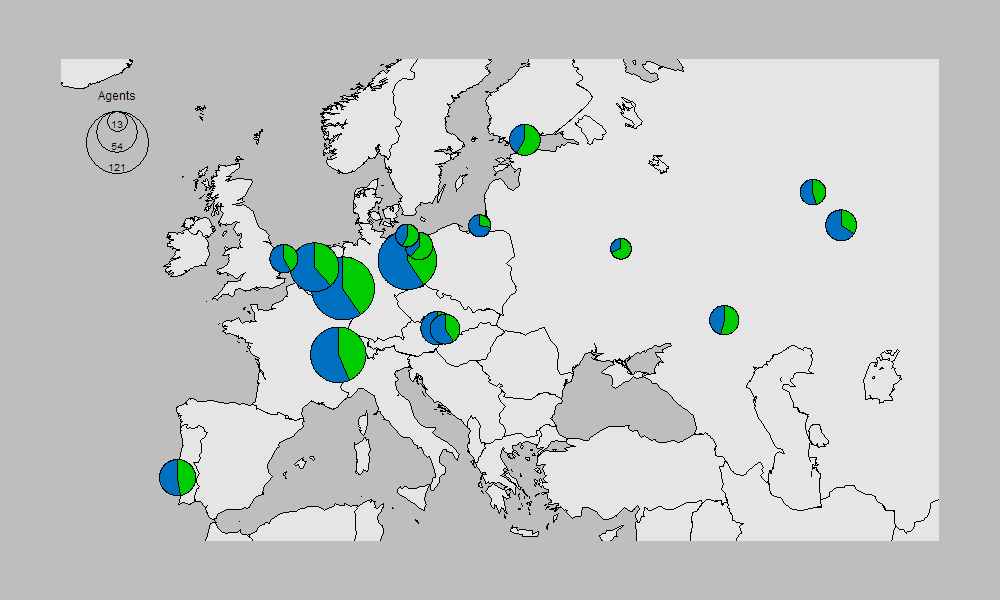
The average event we have was attended by 44 agents, roughly 46% Enlightened and 54% Resistance. The faction distribution matches exactly as that seen in the Top 1000 dataset, suggesting that this distribution holds not only in the Top 1000 but for agents in general on a global scale. Emphasis on global, because while the Resistance may outnumber the Enlightened on a global average, things are much more interesting locally, as seen here:

At a glance, we see the global distribution of cities that participated in our dataset, which is a rough estimate of global player distribution. Faction distribution can also be seen, varying from ENL dominated events in Hong Kong to RES dominated events in Mexico.
As previously known, the majority of players are centered in the North America and Europe.
AP and Level Gain
Of the 2316 agents, one gained 4 levels, fifteen gained 2 levels, fifty gained 2 levels, 227 gained 1 level and 2023 did not gain levels. This is not unexpected, given that the average level of an agent was L9.3, which only really new players got huge boosts to their levels.
AP gain however, is less biased towards new players, and perhaps unsurprisingly, the higher level an agent was entering the event, the more AP they left with. This trend persists even after L8, so it’s likely not explained simply by access to better items. Hardcore players play hard.

Overall, the average agent gained 114,700 AP during the event, with the maximum being 1,122,161 and 1,475,600 by two agents in Hong Kong. A tally of all 2316 agents around the world can be found in this spreadsheet


After the event, the distribution of agent levels mirrors that previously discussed at +IngressStatistics, with large population of agents stuck at Levels 8 and 10 due to the medal requirements. This was prior to the three new medals though, so perhaps this has shifted by a bit.

Geographical AP and Gain
Cities had varying amounts of AP gain during their events, with the average agent in Szczecin, Poland and Hong Kong, Hong Kong gaining 175,000AP, while those in Chang Mai, Thailand and Cincinnati, USA gaining 30,000AP (Note: Hong Kong’s event was 4 hours, but the other three cities at the extremes all had 2 hour events). Without knowing what went on at these locations it is difficult to explain these differences, but one assumes that some events focused on helping newer agents while others were AP battles between tested veterans.

While it’s possible that #IngressFS attendees do not provide a good representation of the player population in the city, it’s still somewhat fun to see how average AP distributions differ throughout globally. The average agent in Vienna, Austria and Kaliningrad, Russia have 14,000,000 AP, while the average agent in Hachinohe, Japan and Ottawa, Canada have 1,500,000 AP.

City Rankings
Every city that participated in IngressFS battled for different amounts of time from 1 to 4 hours. To find where agents fought the hardest, this tally divides the AP by the number of agents and by number of hours the event went for.

In 36 of the cities, the Resistance had more agents but in 30 of the cities, the Enlightened gained more AP in total. The comeback score shows which city with an outnumbered side can make the best comeback. The comeback score is calculated by the difference in each teams’ AP per Agent per hour multiplied by the difference in agent numbers for each side

While it’s only data from a third of the 140 events, and a fraction of the entire Ingress population, hopefully this sheds some insight into the Ingress demographic on a global scale. If you have any suggestions, be sure to comment and hopefully we’ll get some more interesting maps and graphs, if not here at Fev Games, then over at the +IngressStatistics G+ community